Spectrographs
Spectrographs are 3-D views in the
"frequency domain" ◳ of time-varying data and signals. A typical Spectrograph shows frequency on the vertical axis, time on the horizontal axis,
and amplitude encoded as variations in color or gray-shading. Spectrographs are commonly used when the frequency of one or more signals varies over time, and it's important to clearly distinguish amplitude, or "magnitude", of the variation. Audio, radio,
astronomy, optics, and vibration are examples of scientific areas where spectrographs serve as an essential tool.
Spectrographs are normally generated from Fourier Transform results, either DFT (Discrete Fourier Transform) or FFT (Fast Fourier Transform). Typically an "inherent frame size" is chosen based on "quasi-stationary" properties of the time domain signal, followed by
windowed, overlapped FFT Fourier analysis using the inherent frame size.
Because a spectrograph is essentially a series of "moving images", with width corresponding to inherent frame size and height to frequency range, the images can also be used in deep learning. The
SigSRF "Predictive Analytics" page ◳ shows an example of this, following these basic steps:
- combining one or more weighted time series to generate a single linearly sampled time domain signal
- performing sliding window FFT analysis on the time domain signal to generate spectrograph images
- performing CNN (convolutional neural network) deep learning on the spectrograph images
The time series data are pulled from event log files, in arbitrary text form, of the type commonly found in a wide variety of applications, including telecom, infrastructure monitoring, transportation, etc. One can think of this approach as a "frequency domain video", in which
time-varying frequency information contains system behavioral information, which must be extracted and learned in order to provide predictive value.
In speech recognition, a type of
Mel scale ◳ spectrograph (a Mel scale frequency axis reflects non linear sensitivity of human hearing) is used as the input layer for a
multilayer
"Time Delay" neural network, or TDNN ◳. Does this imply the human brain "sees" speech in order to recognize it ? Possibly.
Below are some examples of Signalogic spectrograph displays, taken from signal processing applications including voice compression, speech recognition, and fax relay.

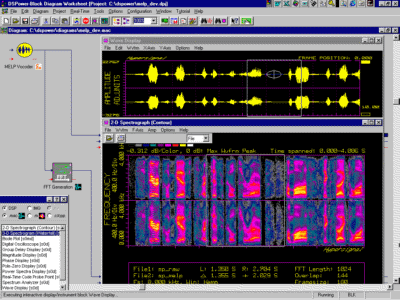
Frequency domain (2-D spectrograph) and time domain (waveform display). Frequency shown on vertical axis, time on horizontal axis, and energy (amplitude) shown as color variation
|

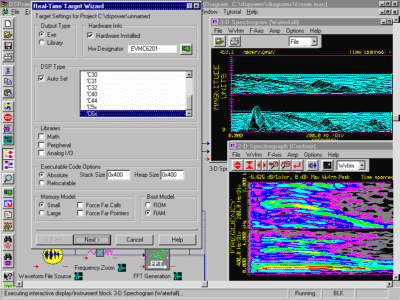
Frequency domain displays: a) Log Magnitude/Log Frequency, b) Waterfall (3-D Spectrogram), and c)2-D spectrograph ("Submarine Sonar view")
|

Waterfall (3-D Spectrogram) and 2-D Spectrograph Displays
|

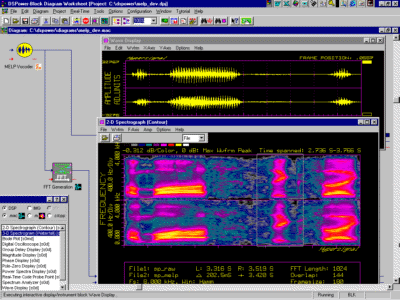
Frequency domain (2-D Spectrograph) and time domain (waveform
display/edit) graphs of pre-MELP speech data (trace 1) and MELPe
codec processed speech data (trace 2)
|
|
|

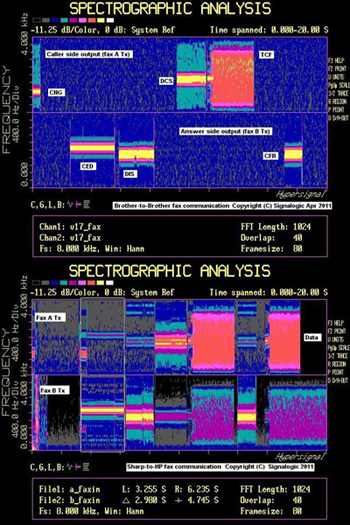
Spectrograph showing facsimile (fax) communication between (i) two Brother fax machines, and (ii) Sharp and HP fax machines. Note that CNG, CED, DIS, DCS, TCF, CFR, and data transmission tones have been labeled
|


